Libraries 2026
GnuplotEx
Gnuplot 6 for Elixir, with SVG-first output.
GnuplotEx is an Elixir wrapper for Gnuplot 6 and later, designed for the way Elixir data work actually looks: a series or a tensor in, a clean SVG out. It is for data science, machine learning visualisation, and scientific computing — places where a chart is a document, not a dashboard widget.
Why Gnuplot
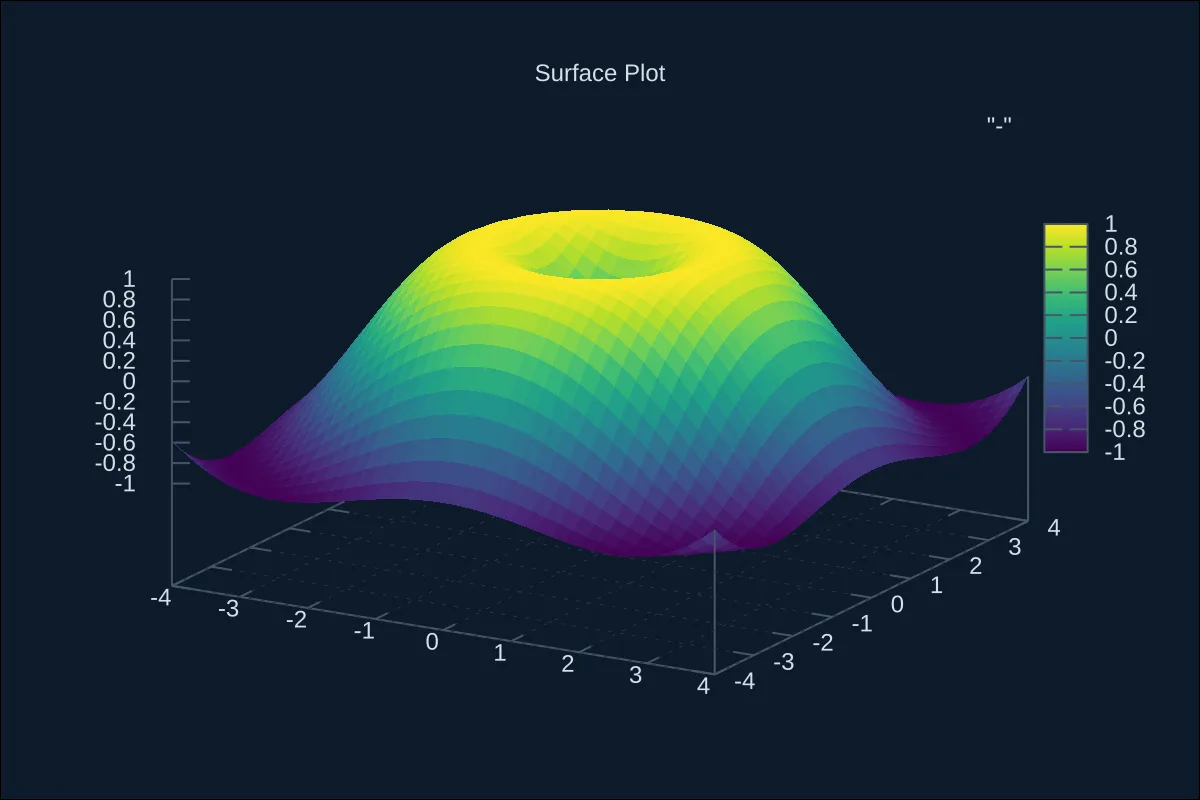
Gnuplot is decades old, fast, and has no runtime to install beyond the binary. It renders 3D surfaces, contour plots, and multi-axis charts that most JavaScript libraries handle badly or not at all. The wrapper’s job is to make that power feel like an Elixir API rather than a command-line string.
The API
High-level functions cover multi-series line and scatter plots, bar charts, 3D surfaces, and spider charts. Lower-level options expose Gnuplot’s own settings when the high-level API is not enough. Output is SVG first, which means the result is text: easy to embed, diff, theme, and inspect.
Data sources
Nx tensors and Explorer data frames are optional integrations. A plot can be built from a tensor without converting it into lists first, and Explorer users can plot a series without writing the extraction code by hand.
GnuplotEx is published on Hex as gnuplot_ex.